Primary maths: Statistics

Explore this collection of lesson ideas and activities to introduce and develop KS1 and KS2 pupils' knowledge of statistics

Tes Resources Team

Colourful Bar Chart Representing KS1 & KS2 Statistics Lessons In Primary Maths

Discover top ways to get to grips with graphs, charts and tables with primary learners

With multiple opportunities to gather data relevant to your pupils' lives and apply it to real-life situations, statistics can be one of the most practical topics for you to explore with your class. From bar graphs and tally charts to pie charts and pictograms, we've selected a handful of interesting ways to tackle the topic.

Year 2 statistics resources

Tables - Year 2
Online_Teaching_Resources

Tables - Year 2

(1)
Tables - Year 2 In this Year 2 statistics teaching resource, pupils pupils practise drawing and interpreting simple tables as per the curriculum objectives of the maths Year 2 Programme of Study - Statistics. Content includes: 1. PowerPoint teaching presentation 2. Activities to support the te...
Year 2 statistic assessment
sarahwhitneystead

Year 2 statistic assessment

(1)
Year 2 statistic assessment covering: Identifying block graphs, tally charts and pictograms Constructing block graphs, tally charts and pictograms Answering questions on block graphs, tally charts and pictograms Asking questions on block graphs, tally charts and pictograms For this...

Year 3 statistics resources

Year 3 - interpreting  pictograms (1)
busyprimaryteacher247

Year 3 - interpreting pictograms (1)

(26)
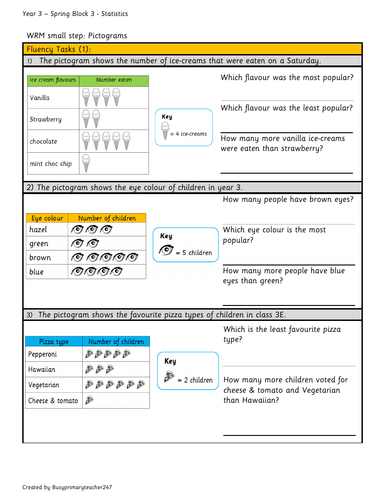
This resources enables children to read and interpret information from pictograms, make comparisons and ask questions about data. WRM Small Step: pictograms Curriculum links: -Interpret and present data using bar charts, pictograms and tables. -Solve one-step and two-step questions [for example,...
Statistics Mastery Activities     Year 3
Andrew Long

Statistics Mastery Activities Year 3

(6)
Click the link below for the complete Year 3 resource pack (all 34 objectives) **[Year 3 Maths Mastery Pack](https://www.tes.com/teaching-resource/maths-mastery-activities-year-3-11878963)** These are a range of activities/tasks to demonstrate mastery and develop deeper thinking and deeper unders...
2. Statistics: bar charts lesson pack (Y3)
MrsSBunny

2. Statistics: bar charts lesson pack (Y3)

(2)
This ready-to-use, top quality set of resources allows teachers to easily teach the Year 3 Maths topic of bar charts to a mixed ability class. This lesson links well with White Rose Maths Statistics. It forms part of a series of lessons on money which include coverage of the objectives: Inte...
Year 3- Statistics- Block 3- White Rose Maths
mrkeechsclassroom

Year 3- Statistics- Block 3- White Rose Maths

(1)
Carefully crafted teaching presentations with everything you need to teach each small step of White Rose Maths Year 3 Spring Block 3 Statistics. Each presentation follows the mastery approach of concrete, pictorial and abstract, whilst implementing all aspects of Rosenshine's principles of instructi...

Year 4 statistics resources

Year 4 Statistics (Unit of Work)
Andrew Long

Year 4 Statistics (Unit of Work)

(7)
This is a COMPLETE resource pack (up to 10 lessons) for teaching all Year 4 Statistics objectives. Included is differentiated worksheets (28 pages) to teach tables, bar charts, time graphs, pictograms and other graphical representations of data (in Word and PDF format - the Word versions can of cour...
1. Statistics: interpret charts lesson pack (Y4)
MrsSBunny

1. Statistics: interpret charts lesson pack (Y4)

(1)
This ready-to-use, top quality set of resources allows teachers to easily teach the Year 4 Maths topic of interpret charts to a mixed ability class. This lesson forms part of a series of lessons on time which include coverage of the objectives: Interpret and present discrete and continuous data ...
Year 4 Statistics - Comparison, Sum and Difference Lesson
krisgreg30

Year 4 Statistics - Comparison, Sum and Difference Lesson

(1)
A fully resourced statistics lesson for being able to compare data presented through pictograms or bar charts through addition and subtraction questions in Year 4 based on the objective from White Rose Maths. Included in the resource is: * A lesson PowerPoint with starter, vocabulary, modelling (...

Year 5 statistics resources

Line Graphs KS2
Magictrickster

Line Graphs KS2

(4)
A Powerpoint looking at Line Graphs. plus a two sided A4 PDF worksheet. The powerpoint has 14 slides (Plus one title and one end slide). There are four examples looking at how to draw line graphs, followed by 10 example questions based on the 4th Line graph drawn. The worksheet has two quest...
Year 5     Statistics     Timetables - White Rose Maths
mrkeechsclassroom

Year 5 Statistics Timetables - White Rose Maths

(1)
Carefully crafted teaching presentation with everything you need to teach this small step of White Rose Maths Year 5 Autumn Block 3 Statistics. This presentation follows the mastery approach of concrete, pictorial and abstract, whilst implementing all aspects of Rosenshine's principles of instructio...

Year 6 statistics resources

Maths SATs Bundle (Statistics)
Maths4Everyone

Maths SATs Bundle (Statistics)

(18)
Topic-focused SATs questions and **fully-worked solutions** for the STATISTICS strand. Click **[tes.com/../bundles ](http://www.tes.com/resources/search/?authorId=21433720&q=SATs%20Bundle)** for booklet bundles of the other strands.``I have put all my STATISTICS booklets together in this ...
Pie Charts, Line Graphs & Means Y6 Statistics Summer Block 3
Roger Hall

Pie Charts, Line Graphs & Means Y6 Statistics Summer Block 3

(1)
Year 6 National Curriculum Objectives covered: * illustrate and name parts of circles, including radius, diameter & circumference & know that the diameter is twice the radius * interpret and construct pie charts and line graphs and use these to solve problems * calculate and interpret the m...
Calculate and interpret the mean as an average
PrimaryPros

Calculate and interpret the mean as an average

(1)
_**Please find within this download:**_ A detailed and engaging PowerPoint, Differentiated (SEN, LA, MA, HA, Mastery and Greater Depth) Worksheet with Answer Sheet for a complete lesson on this Year 6 Statistics statement: calculate and interpret the mean as an average. _**The PowerPoint has t...
Pie Charts
Shamster

Pie Charts

(3)
A lesson that has been written by an Outstanding Practitioner who leads on Mastery. Planned in detail can be used as a revision resource of whole lessons. This contains 1 PowerPoint. PowerPoint 1 - Lesson on Interpreting Pie Charts. 16 colourful interactive slides. Lots of questions to assess und...